Utility Usage and Spend in Real Time
Our patent* has been approved for the technology we developed to help our clients optimize their energy footprint. This real-time energy data system, called Cufflink, is the first application on the market to report real-time utility usage and spend.
Cufflink provides trustable insight, integrating data from many different sources to provide Actionable Energy Intelligence. This is a huge leap forward for industrial, commercial and building energy management!
*Patents: US 10460361, US 11461814, CA 3077403, US 12229811

How does Cufflink show real-time energy cost?
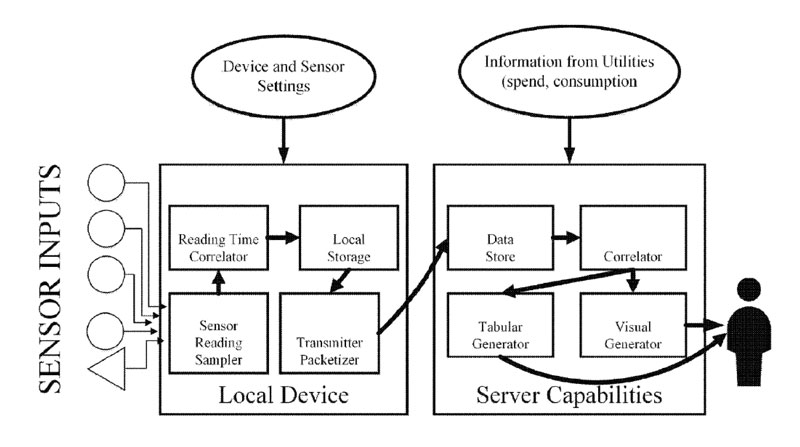
The Cufflink system securely compiles utility consumption data from multiple sensors through a local device into a central data warehouse. We then match the data to current utility pricing information, thus providing live spend data alongside live usage data.
Cufflink’s cloud-based portal presents this real-time utility data visually, using a variety of reporting formats. This allows energy teams to manage and control their water and energy usage, reducing energy costs across multiple buildings.
Cufflink addresses the need to analyze, track and calculate granular utility consumption. It can gather disparate utility data, correlate this data, and calculate the composite utility consumption and spend in real time. This is an extremely useful utility data service. Cufflink is like a Fitbit for buildings.

Problems solved with real-time energy data
Without Cufflink, utility cost information is available only through monthly utility bills. Utility providers capture their own data for billing purposes, and meters usually store information in monthly intervals. This means that energy managers only receive a monthly bill for each utility without real-time detail.
Even when more detailed information (IDR) is available, it often consists of only usage data, not spend. The current, antiquated utility bill system does not allow for modern energy analysis. Cufflink enables real-time interaction with your buildings, allowing you to be proactive. For companies running on $20 million per year in annual utility spending, this is a huge improvement.
Many commercial energy managers collect their own data, but this is done one item at a time. Consumers usually rely on the makers of their equipment to provide usage data, or they may purchase third party equipment. However, existing energy management systems for commercial buildings have failed to integrate real-time energy consumption and pricing data.
Why wasn’t this invented sooner?
Mountain Vector Energy overcame several challenges with the invention of Cufflink:
- The challenge of utilizing disparate meter information that is not correlated in order to generate composite cost information.
- The vastly differing protocols and types of data, not only from different sensors but also from different utilities.
- Generating and correlating disparate utility cost information of differing types of consumed resources. This enables the comparison of electric, gas and water all in one place.
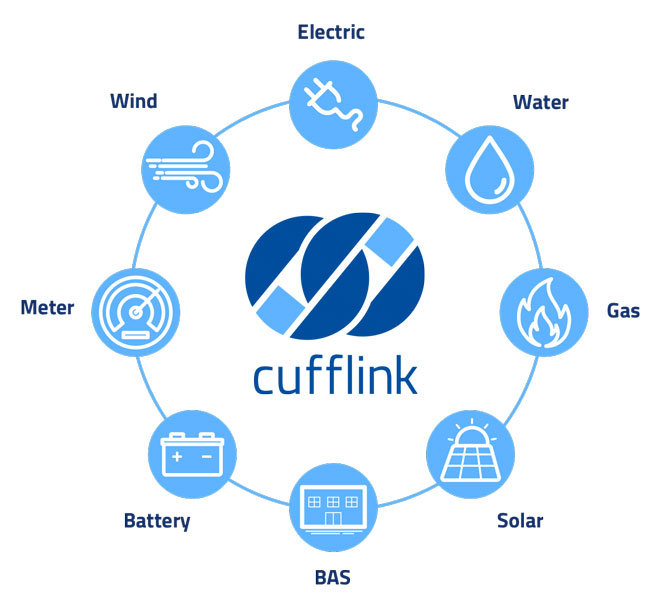
Cufflink provides devices, systems, methods and programs through which these challenges can be overcome. It can utilize diverse information from any data source.
The combined and spend-correlated data visualization provides energy managers with the most accurate information in real time. This allows them to make informed changes and immediately measure the impact of energy conservation measures for commercial buildings.

Custom real-time energy data analytics
Cufflink compiles data from a wide variety of inputs, and the output can be configured to achieve various reporting goals. This allows energy managers to understand their composite consumption of energy. Even when systems are personalized and varied, Cufflink can correlate data to provide insight. The Cufflink software can even bridge data gaps, making the most accurate assessment possible.
Cufflink brings a new level of reporting flexibility. Limitations of existing utility sensors or data do not constrain the limitations of existing utility sensors or data. Energy managers can instantly see their utility consumption and spend at any point in time to take immediate actions when appropriate.
We’re thinking about energy content in a new way. This allows you to visualize vast, disparate data streams at the interval level to make informed energy management decisions in real time.
We built it because it didn’t exist.
